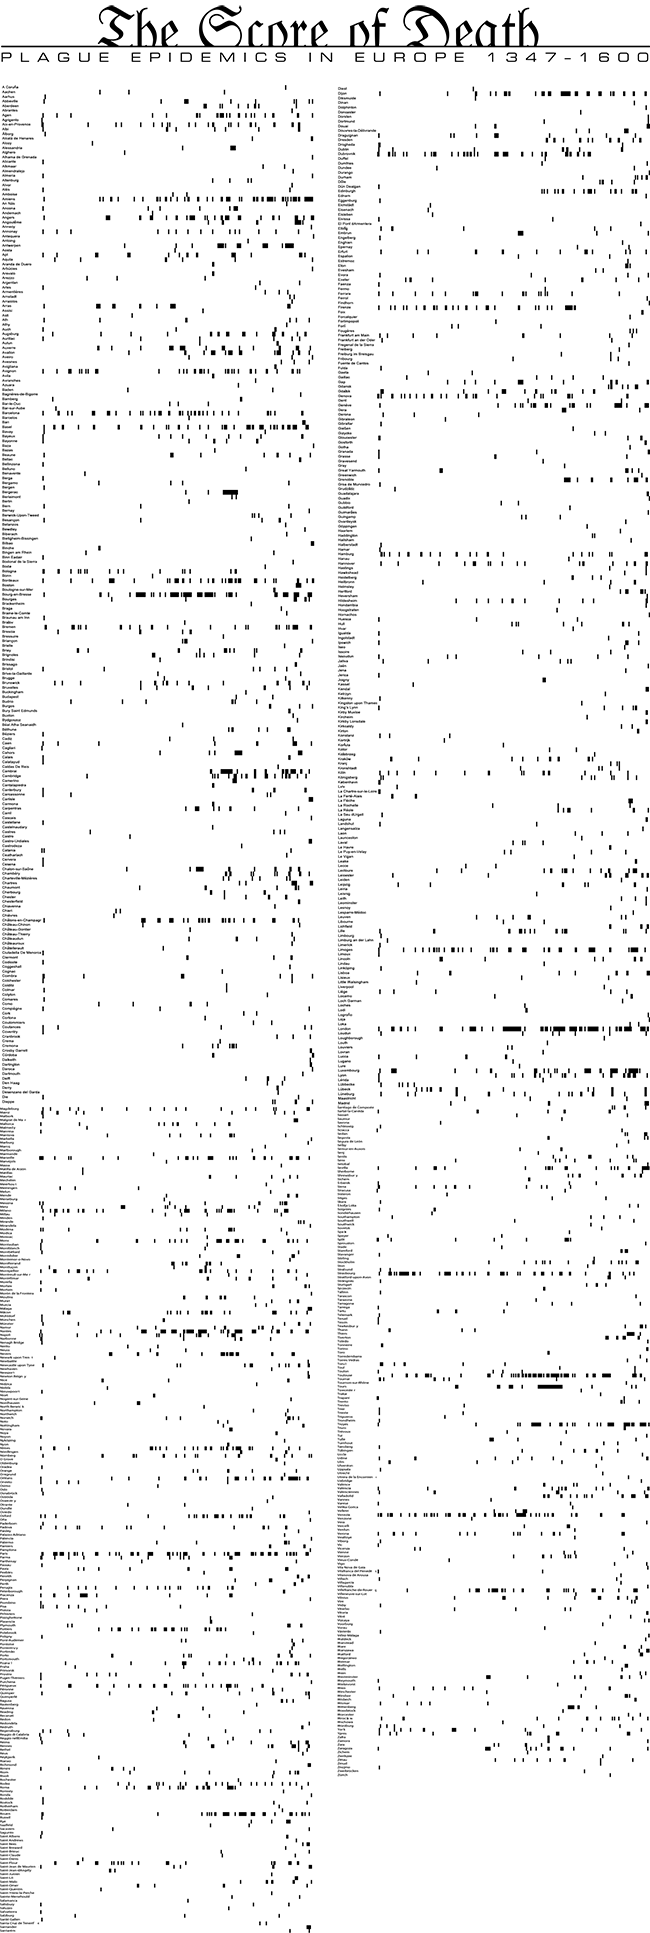
The Score of Death: Plague Epidemics in Europe 1347–1600
The Yersinia dataset provides georeferences for the places of plague occurrences in Europe between 1347 and 1600. These include for each year of occurrence, placenames, coordinates and region names. There are approximately 850 georeferenced unique locations in the dataset. The file is distributed in three formats: Microsoft Excel 2003 file, Unicode UTF-16 comma-delimited text file, KML file.
The source used for generating Yersinia is Jean-Noël Biraben, Les Hommes et la peste en France et dans les pays européens et méditerranéens, Paris/La Haye, Mouton/École des hautes études en sciences sociales, 1975–6.
Data collection and geolocalisation by Claire Priol* and Anne Tournieroux*, visualization by Vlad Atanasiu**, and conceptualisation and coordination by Ezio Ornato* and Vlad Atanasiu (* Laboratory for Medieval Studies of Paris, National Center for Scientific Research / University Paris 1, Paris, France; ** Visualization Commission of the Austrian Academy of Sciences, Vienna, Austria), as part of the Project Bernstein: The Memory of Papers: Image-based paper expertise and history, 2006–2009.
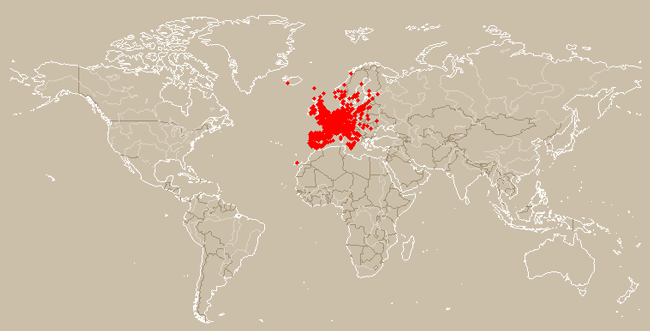
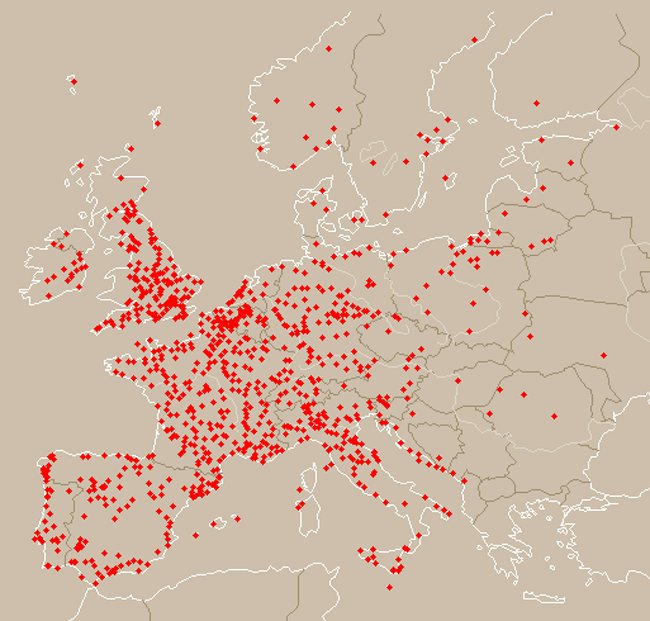
Locations
Spatial distribution of locations in the Yersinia dataset.
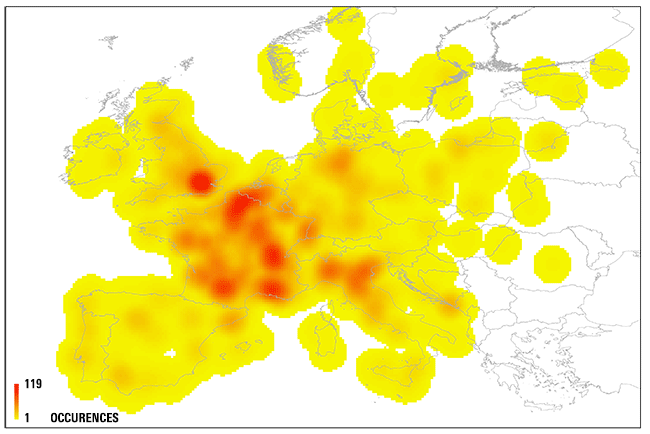
Frequency
Plague outbreaks frequency across space.
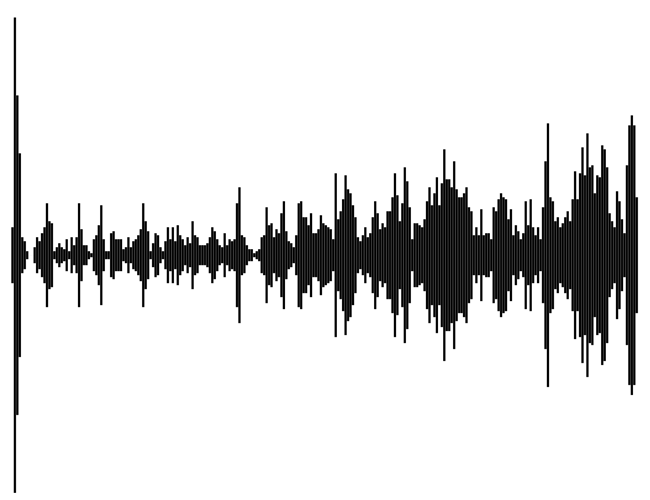
Timeline of plague outbreaks. X-axis: years; Y-axis: number of locations where the plague occured (maximum: 119).
Plague outbreaks frequency by location and year (PDF document).
Animation
Plague outbreak locations across space.
Image credits: danse: Danse macabre, Guelph, Ontario, CA; virus: The Learning Company
 |